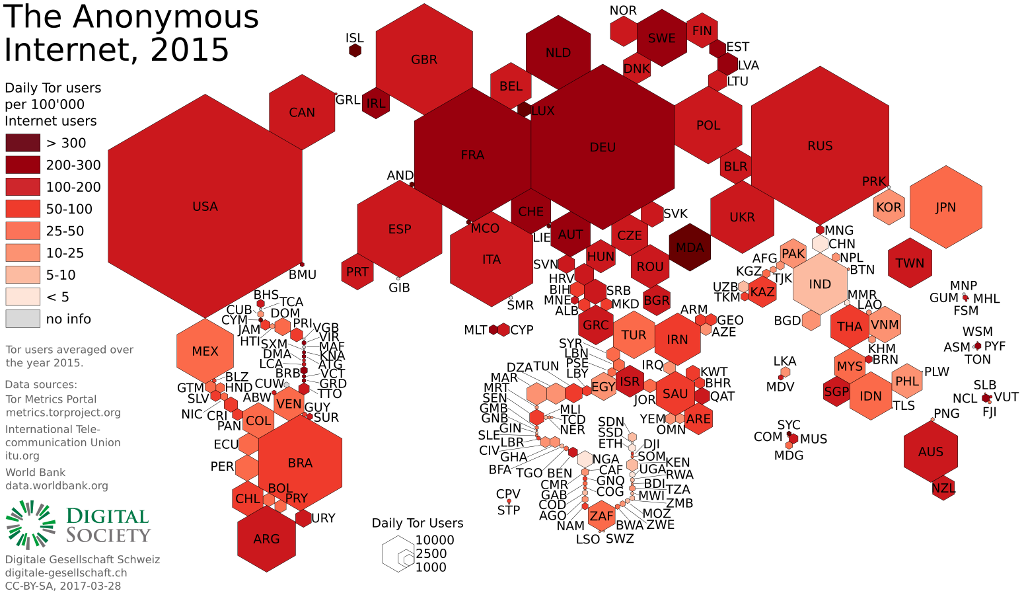
Tor is an anonymity network consisting of over 7000 servers that enable secure internet usage, available as a free and open source software. Each day, over two million users connect to the network. Today, we release a new version of the well-known infographic «The Anonymous Internet» [1,2,3] with the newest available data. This cartogram shows the usage of the Tor network per country in both absolute usage and relative to the country’s number of internet users.
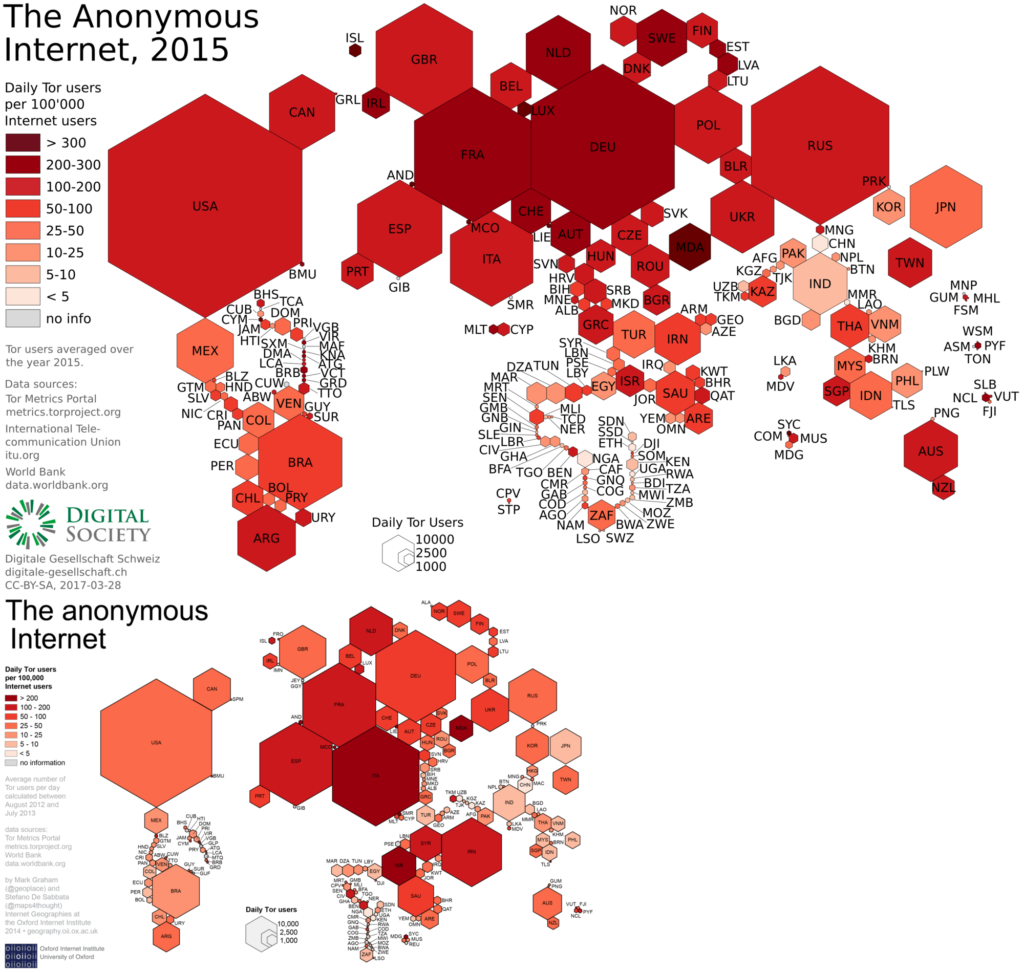
The original cartogram was made by Stefano De Sabbata and Mark Graham of the Oxford Internet Institute, with data from a one-year period between August 2012 and July 2013. Our version uses data over the year 2015. While the Tor Project has already released data from 2016, population and internet usage data from The World Bank and the International Telecommunications Union is only available up to the year 2015.
Description
Each hexagon represents a country’s absolute Tor usage (number of daily Tor users) by its area, and the number of daily Tor users relative to the number of that country’s internet users by its colour, where darker colour corresponds to heavier usage. The countries are placed roughly at their geographical position.
Comparison to the original 2012-2013 version
In contrast to the original version, two changes have been introduced: First, the conversion factor of absolute usage to a country’s area on the map (in pixels) has been reduced by factor 3.75. This means on the new version, the same area accounts to 3.75 times the number of users compared to the original version. Second, a new colour step has been introduced for the relative number of users: Our version differentiates between «200 to 300» and «over 300» for the daily number of Tor users per 100’000 internet users.
Data sources
At the end of the article, you find the raw data used to make this infographic. Tor usage data is available on the Tor metrics portal, which was averaged over the range from 1st January 2015 to 31st December 2015 (with the exception of 2015-10-14, for which no statistics are available). Usage data includes both normal connections and connections over bridges. Population data and internet usage data for the year 2015 is provided by the World Bank, and the internet usage data was collected originally by the International Telecommunications Union.
Findings
Overall Tor usage has more than doubled from 2012-2013 to 2015, however it is unclear how much of that is still accountable to the 2013 Sefnit event. In eight countries, Moldova, Monaco, Iceland, Liechtenstein, Seychelles, Cayman Islands, Luxembourg and Andorra, relative Tor usage is now at over 300 Tor users per 100’000 internet users.
Moldova again has the biggest relative Tor usage: 963 Tor users per 100’000 internet users, which is almost 1%. An article by the OpenNet Initiative indicates that while Moldova has no state-level or ISP-level internet censorship, many people access the Internet from their workplace or from internet cafés. Most companies and internet cafés in Moldova have some kind of censorship equipment deployed in their networks.
Sadly, the number of Tor users in China has diminished even further. This mainly shows that the Big Firewall of China is effective in preventing connections to the Tor network from inside the country. An analysis of Tor usage prevention in China has been made by Roya Ensafi of Princeton University, with a presentation at 32C3. See the hexagon of Taiwan for comparison.
Countries with an absolute usage of less than 10 users per day were omitted as they were too small for the map. This currently includes Nauru, Eritrea, Kiribati and Tuvalu.
Comparison between the new map 2015 and the original map from 2012/08-2013/07
Downloads